India Unemployment Rate 2026 If you’ve been job hunting for months and keep seeing headlines about India’s unemployment rate sitting at a comfortably low 3.2%, there’s a good chance the gap between that number and your actual experience has left you wondering if something’s wrong with you rather than the job market. It isn’t. The 3.2% figure is real, officially reported, and simultaneously almost useless for understanding what a graduate job seeker is actually up against, because of how it’s calculated and who it includes.
Here’s the number that tells a genuinely different story: unemployment among graduates and postgraduates runs 3 to 4 times higher than that overall national average, according to the same official survey producing the 3.2% headline. In some specific breakdowns, unemployment among educated women in the 15-29 age bracket has been recorded above 39%. If you’re a graduate struggling to land your first role, the honest, data-backed picture is that you’re navigating a labour market considerably tougher than the headline figure suggests — not imagining it.
Table of Contents
Why There Are Actually Three Different “Official” Unemployment Rates
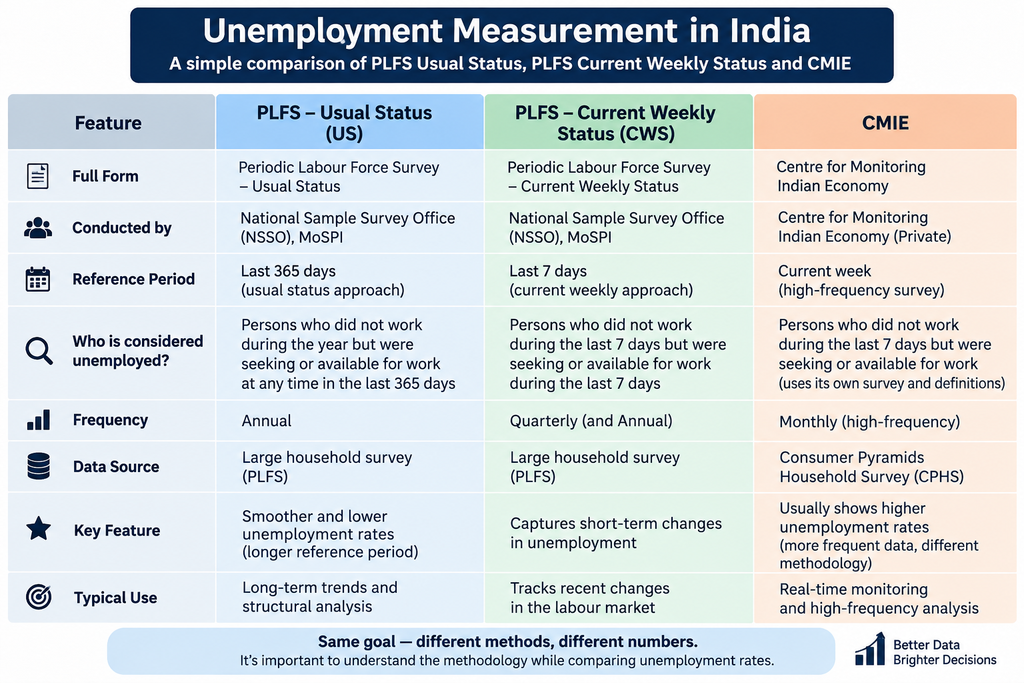
This is worth untangling clearly, since seeing different numbers in different articles — 3.2%, 4.9%, 5.5%, 7-8% — understandably reads as contradiction, India Unemployment Rate 2026 when it’s actually three different measurement approaches answering three different questions:
The Annual PLFS “Usual Status” rate (currently 3.1-3.2%) measures whether someone was employed for a majority of the preceding year, based on the Periodic Labour Force Survey conducted by India’s National Statistical Office. This is the headline figure most commonly cited in government communication and news coverage, and it’s structured in a way that counts someone as “employed” even with fairly minimal or irregular work across the reference year.
The Monthly PLFS “Current Weekly Status” rate (running 4.9-5.5% through 2026) measures whether someone worked in just the past seven days specifically. This captures short-term, week-to-week disruption in a way the annual measure doesn’t, which is exactly why it consistently reads higher — it’s measuring a narrower, more immediate window where someone between jobs or in seasonal work shows up as unemployed, even if they’d count as “employed” under the annual measure’s more forgiving full-year standard.
CMIE’s Consumer Pyramids Household Survey (typically 7-8%) is run by the Centre for Monitoring Indian Economy, a private research organization, using its own separate methodology and sampling approach distinct from the government’s PLFS. CMIE’s numbers have consistently run higher than official PLFS figures for years, reflecting genuine methodological differences in how each survey defines and measures labour force participation and employment status, not one source being simply “wrong” and the other “right.”
None of these three numbers is fraudulent or manipulated — they’re legitimately measuring different things, over different time windows, using different definitions of what counts as employment. The mistake is treating any single one of them as the complete picture of India’s job market, when the more honest approach is looking at all three together to understand both the headline trend and its texture, much the way understanding a company’s full salary structure rather than just its headline CTC figure gives a more accurate picture of what an offer is actually worth.
The Number That Actually Matters If You’re a Graduate
Buried inside the same PLFS data producing the reassuring 3.2% headline is a consistent, well-documented pattern: unemployment rises sharply with education level, rather than falling as basic economic intuition might suggest. The reported pattern is graded and consistent — postgraduates face higher unemployment than graduates, who face higher unemployment than those with only secondary education, who face higher unemployment than those with no formal education at all. One detailed breakdown found unemployment at just 0.3% among those who are not literate, compared to 15.79% among graduates in the working-age population — a genuinely stark inversion of what you might expect, and a pattern some researchers attribute partly to more educated job seekers being less willing to accept low-skilled informal work, combined with a genuine shortage of regular salaried positions matching their qualifications and expectations.
The Gender Gap That’s Actually Getting Worse, Not Better
Most positive coverage of India’s recent employment data emphasizes the encouraging headline trend — youth unemployment has genuinely declined, from 10.9% in 2022 to 9.9% in 2025, the first time it’s dropped below 10% in four years. That decline is real and worth acknowledging. But a specific, less-discussed reversal sits underneath it: female youth unemployment actually rose from 10.3% in 2023 to 11.3% in 2025, moving in the opposite direction of the broader positive trend during the exact same period. Separately, unemployment among educated women specifically has been recorded at strikingly high levels in some breakdowns — above 39% among female graduates in the 15-29 age bracket in one detailed analysis. If you’re a woman graduate navigating this job market, the aggregate “unemployment is improving” headline is genuinely not describing your specific experience as accurately as it might describe a male peer’s.
The Urban-Rural Divide Runs the Opposite Way You Might Expect
Another counterintuitive pattern worth knowing: urban unemployment consistently runs meaningfully higher than rural unemployment across nearly every recent PLFS reading — urban youth unemployment recorded at 13.6% in 2025 versus 8.3% in rural areas over the same period. This inverts a common assumption that cities offer more job opportunities and therefore lower unemployment. What’s actually happening is more subtle: rural employment figures are inflated by agricultural work and informal, own-account activity that counts as “employment” under the survey’s definitions, even when it’s low-paying, unstable, or underemploying someone relative to their actual skills. Urban unemployment, concentrated among more formally job-seeking populations with fewer informal fallback options, more accurately reflects genuine joblessness in the specific sense most people mean when they say “can’t find a job.”
Why Female Labour Force Participation Numbers Can Be Misleading Too
A genuinely dramatic shift in India’s labour data over the past several years is the near-doubling of female labour force participation, from roughly 23% in 2017-18 to approximately 42% in the most recent PLFS cycle — one of the largest recorded shifts in any major economy over such a short window. This sounds like unambiguously good news, and it partly is, but the composition matters: most of this increase is concentrated in rural areas and in own-account work or unpaid family helper categories, rather than in salaried, formal employment. Urban female labour force participation remains below 30%, still well short of comparable benchmarks in other major Asian economies, and salaried female employment specifically has grown far more slowly than the headline participation figure suggests. The lesson here is consistent with the broader theme of this article: a single aggregate number, celebrated in isolation, often obscures a more complicated and less uniformly positive underlying pattern.
Where This Sits Relative to the New Labour Code Changes
If you’ve been following the broader labour code restructuring covered elsewhere on this site — the new 50% basic pay rule, the faster full-and-final settlement timeline — it’s worth connecting this employment data to that same regulatory transition. Several analyses tracking both threads together note that the compliance burden of the new codes, alongside genuine structural questions about skill-matching between what educational institutions produce and what employers actually need, remain live, unresolved challenges even as the headline employment trend shows gradual, uneven improvement. Neither story exists in isolation from the other — a labour market simultaneously restructuring its compensation rules while still working through a persistent graduate employment gap is genuinely more complex to navigate than either trend discussed alone would suggest.
The Skills Mismatch Explanation, and Its Limits
A commonly cited explanation for the graduate unemployment gap is a mismatch between what educational institutions produce and what employers actually need — graduates emerging with degrees that don’t map cleanly onto available job requirements, whether due to curriculum gaps, insufficient practical or industry exposure during education, or simply an oversupply of graduates in specific fields relative to genuine market demand. This explanation carries real truth, and it’s part of why this site consistently covers skilling initiatives like TASK Telangana, APSSDC, and the Skill India Digital Hub, since building specific, demonstrable, employer-relevant skills alongside a formal degree is one of the more actionable responses available to an individual job seeker navigating this structural gap.
That said, it’s worth being honest that “skills mismatch” isn’t a complete explanation on its own. Some portion of graduate unemployment reflects genuine job scarcity relative to the number of graduates entering the workforce each year, independent of how well-matched any individual candidate’s specific skills are — a structural imbalance that no amount of individual upskilling fully resolves at the aggregate level, even though it remains genuinely worth pursuing at the individual level to improve your own specific odds within that broader constraint.
What You Can Actually Do With This Information
Understanding this data doesn’t directly get you a job, but it does usefully reframe two things worth acting on. First, if your job search has taken longer than you expected based on a vague sense that “unemployment is only 3.2%,” recalibrating your expectations against the actual graduate-specific data can reduce some of the unproductive self-blame that comes from measuring yourself against the wrong benchmark. Second, and more practically, understanding where the gap concentrates — urban graduate roles specifically, and particularly for women — can inform genuinely strategic decisions: whether a specific city or sector is more or less saturated with graduate applicants than the national picture suggests, whether pursuing a specific skill certification addresses a real, documented employer need rather than a generic “upskill for the sake of it” impulse, and whether widening your search to include roles or locations outside your initial target might reflect the actual state of demand more realistically than continuing to compete in the most saturated segment of an already difficult market.
Why This Data Also Matters for Competitive Exam Preparation
If you’re preparing for UPSC, state public service commission exams, or any competitive government exam covered elsewhere on this site, it’s worth knowing that PLFS data specifically — rather than CMIE’s private estimates — is treated as the official, examinable source for unemployment and labour market questions in these exams. This isn’t incidental trivia: understanding the distinction between Usual Status and Current Weekly Status measurement, and being able to cite the graduate-versus-overall unemployment gap with actual figures, is exactly the kind of nuanced, source-aware answer that distinguishes a strong response from a generic one in exams testing current affairs and economic literacy. If economics or current affairs forms part of your exam preparation, this specific data — PLFS methodology, the graduate unemployment gap, the female labour force participation shift — is worth committing to memory with genuine understanding rather than just the headline 3.2% figure most casual current-affairs revision stops at.
How Today’s Numbers Compare to the Recent Past
Context from a few years back makes the current trajectory easier to interpret. India’s overall unemployment rate on the Usual Status basis stood at 6.1% in 2017-18, meaning today’s 3.1-3.2% figure represents a genuine, roughly fifty percent decline over less than a decade — a real, substantial improvement by this specific measure, not a stagnant or worsening picture. The youth unemployment trajectory tells a similarly improving story at the headline level, moving from double-digit territory that peaked higher in earlier post-pandemic readings down to the current 9.9%. None of this contradicts the graduate-specific and gender-specific concerns raised above — both things are true simultaneously: the broad national trend is genuinely improving, while specific, well-documented sub-populations (educated women, urban graduates) are seeing meaningfully less benefit from that improvement than the aggregate trend suggests, and in the case of female youth unemployment specifically, are seeing the opposite of improvement over the same recent window.
Regional Variation Is Larger Than the National Headline Suggests
One more layer worth understanding before drawing conclusions from any single national figure: unemployment varies substantially by state, in ways that matter directly if you’re job hunting in a specific region rather than the country as a whole. Some states report unemployment rates below 1%, while others report considerably higher figures within the same national survey period — a gap of several multiples between the best and worst-performing states, all folded into one national average that obscures exactly this kind of disparity. States with stronger manufacturing and industrial bases have generally shown better labour market absorption in recent data compared to states more dependent on agriculture or facing specific structural or political headwinds. If you’re evaluating your own job search difficulty against national data, factoring in your specific state’s actual reported figures, rather than the national blend, gives a meaningfully more accurate benchmark for what you’re actually up against locally.
What This Means for How You Should Read Job Market News Going Forward
Given how differently these three or more measurement approaches can read, a useful habit going forward is checking which specific figure any given headline is actually citing before reacting to it emotionally. A headline citing the annual PLFS Usual Status rate at 3.2% is describing something genuinely different from one citing the monthly Current Weekly Status figure at 5.5%, and both are describing something different again from CMIE’s 7-8% — none of them individually captures what a specific graduate job seeker in a specific city experiences firsthand. If a number seems dramatically at odds with your own lived experience navigating this job market, that gap is often explained by exactly this kind of methodological difference rather than either the data or your own perception being wrong.
A More Useful Way to Think About Your Own Situation
Rather than measuring your own job search against a single national aggregate that wasn’t built to describe your specific circumstances, it’s more useful to think about where you sit within the breakdowns that actually matter: your education level, your gender, whether you’re targeting urban or rural-adjacent opportunities, and your specific state or region, since regional disparities are genuinely significant. A prolonged, difficult job search as a graduate isn’t inconsistent with a “low” 3.2% national unemployment rate — it’s actually precisely what the more granular data, sitting one level beneath that headline number, would predict.
Quick Answers
Why do I keep seeing different unemployment numbers for India?
Because multiple legitimate sources measure it differently — the annual PLFS Usual Status rate (currently 3.1-3.2%), the monthly PLFS Current Weekly Status rate (4.9-5.5%), and CMIE’s private survey (7-8%) all use genuinely different methodologies and time windows.
Is India’s graduate unemployment rate really higher than the overall rate?
Yes, significantly — reported at 3 to 4 times the overall average in recent analysis, with some specific breakdowns showing unemployment above 15% among graduates compared to 0.3% among the non-literate population.
Has youth unemployment in India been improving or getting worse?
Overall youth unemployment has declined, from 10.9% in 2022 to 9.9% in 2025 — but female youth unemployment specifically rose over roughly the same recent period, moving against the broader positive trend.
Why is urban unemployment higher than rural unemployment in India?
Rural employment figures are inflated by agricultural and informal own-account work that counts as employment under survey definitions, while urban unemployment more directly reflects formal job-seeking populations with fewer informal fallback options.
Which unemployment figure should I actually trust?
None in isolation — each measures something real but different; understanding which one a specific headline is citing, and looking at the graduate-specific and gender-specific breakdowns beneath it, gives a far more accurate picture than any single aggregate number.
Does this data suggest my personal difficulty finding a job as a graduate is unusual? No — the data suggests the opposite: a prolonged, difficult job search as an educated job seeker is consistent with, not contradictory to, what the more detailed employment data actually shows once you look past the headline 3.2% figure.
If the structural difficulty behind these numbers is part of what you’re navigating right now, it’s worth pairing this understanding with practical preparation — our guide on Free ATS Resume Builder Tools 2026 and our piece on Salary Negotiation in India both address specific, actionable steps within a job market that these numbers confirm is genuinely more competitive for graduates than the headline figures suggest, and knowing that going in changes how you interpret setbacks along the way, not just how you prepare for the search itself.
Suggested Internal Links
- Trending Category
- Salary Negotiation India 2026: Why CTC Changes Everything
- Free ATS Resume Builder Tools 2026: 7 Tested
- CTC vs In-Hand Salary 2026: What Actually Changed
Suggested External References
- Periodic Labour Force Survey, National Statistical Office: https://www.mospi.gov.in
- Centre for Monitoring Indian Economy (CMIE): https://www.cmie.com
- Press Information Bureau, Government of India: https://www.pib.gov.in